Standby Power Cost Calculator
Estimate idle electricity from standby watts, standby hours, device count, operating days, active use, electricity rate, and optional CO2 factor.
🔌Appliance presets
⚙Standby inputs
Standby kWh = watts × standby hours per day × days ÷ 1000, multiplied by the number of devices. Active kWh uses the same structure with active watts and active hours.
Standby power result
📊Energy split cards
📋Standby watt reference
| Appliance or device | Common standby draw | Typical standby hours | Calculator note |
|---|---|---|---|
| Smart TV | 0.5 to 3 W | 18 to 22 hours/day | Use higher standby watts when quick-start, network wake, or voice wake features remain enabled. |
| Game console rest mode | 2 to 15 W | 16 to 22 hours/day | Download, charging, and remote wake settings can move the idle draw across a wide range. |
| Streaming box | 1 to 5 W | 18 to 24 hours/day | Many small media devices remain network-ready even when the TV is off. |
| Router and modem | 5 to 15 W | 24 hours/day | Always-on networking is usually counted as continuous standby-style base load. |
| Desktop computer sleep | 2 to 10 W | 12 to 22 hours/day | Sleep, hibernate, and off states can differ, so measured watts are useful here. |
| Microwave clock | 1 to 4 W | 23 to 24 hours/day | The clock and control board often dominate energy outside short cooking periods. |
🧮Formula table
| Line item | Formula | What it includes | Result shown |
|---|---|---|---|
| Daily standby kWh | standby W × standby hours × devices ÷ 1000 | Idle draw for one day | Daily standby card |
| Annual standby kWh | daily standby kWh × days | Idle energy across selected days | Annual standby card |
| Annual standby cost | annual standby kWh × kWh rate | Standby operating cost only | Annual standby cost |
| Annual active kWh | active W × active hours × days × devices ÷ 1000 | Energy used while active | Breakdown and split cards |
| Total operating cost | (active kWh + standby kWh) × kWh rate | Combined active and idle energy | Total annual cost card |
| Optional CO2 | kWh × kg per kWh factor | Standby or total emissions estimate | CO2 breakdown rows |
⏱Standby hour patterns
| Use pattern | Active hours/day | Standby hours/day | Where it fits |
|---|---|---|---|
| Always ready | 0 to 1 | 23 to 24 | Microwave clock, smart speaker, printer display, networked hub, or charger left plugged in. |
| Evening entertainment | 3 to 6 | 18 to 21 | TV, console, soundbar, streaming box, or bedroom media setup. |
| Workday device | 6 to 9 | 15 to 18 | Computer monitor, desktop sleep mode, dock, printer, or home office accessory. |
| Continuous base load | 0 | 24 | Router, modem, alarm hub, smart bridge, or any device intended to stay online. |
| Occasional appliance | 0.1 to 1 | 23 to 24 | Microwave, coffee machine display, washer panel, dryer panel, or rarely used electronics. |
🔋Annual standby examples
| Standby draw | Hours/day | Annual kWh | Annual cost at 0.18/kWh |
|---|---|---|---|
| 0.5 W | 24 | 4.4 kWh | $0.79 |
| 1 W | 24 | 8.8 kWh | $1.58 |
| 3 W | 20 | 21.9 kWh | $3.94 |
| 5 W | 20 | 36.5 kWh | $6.57 |
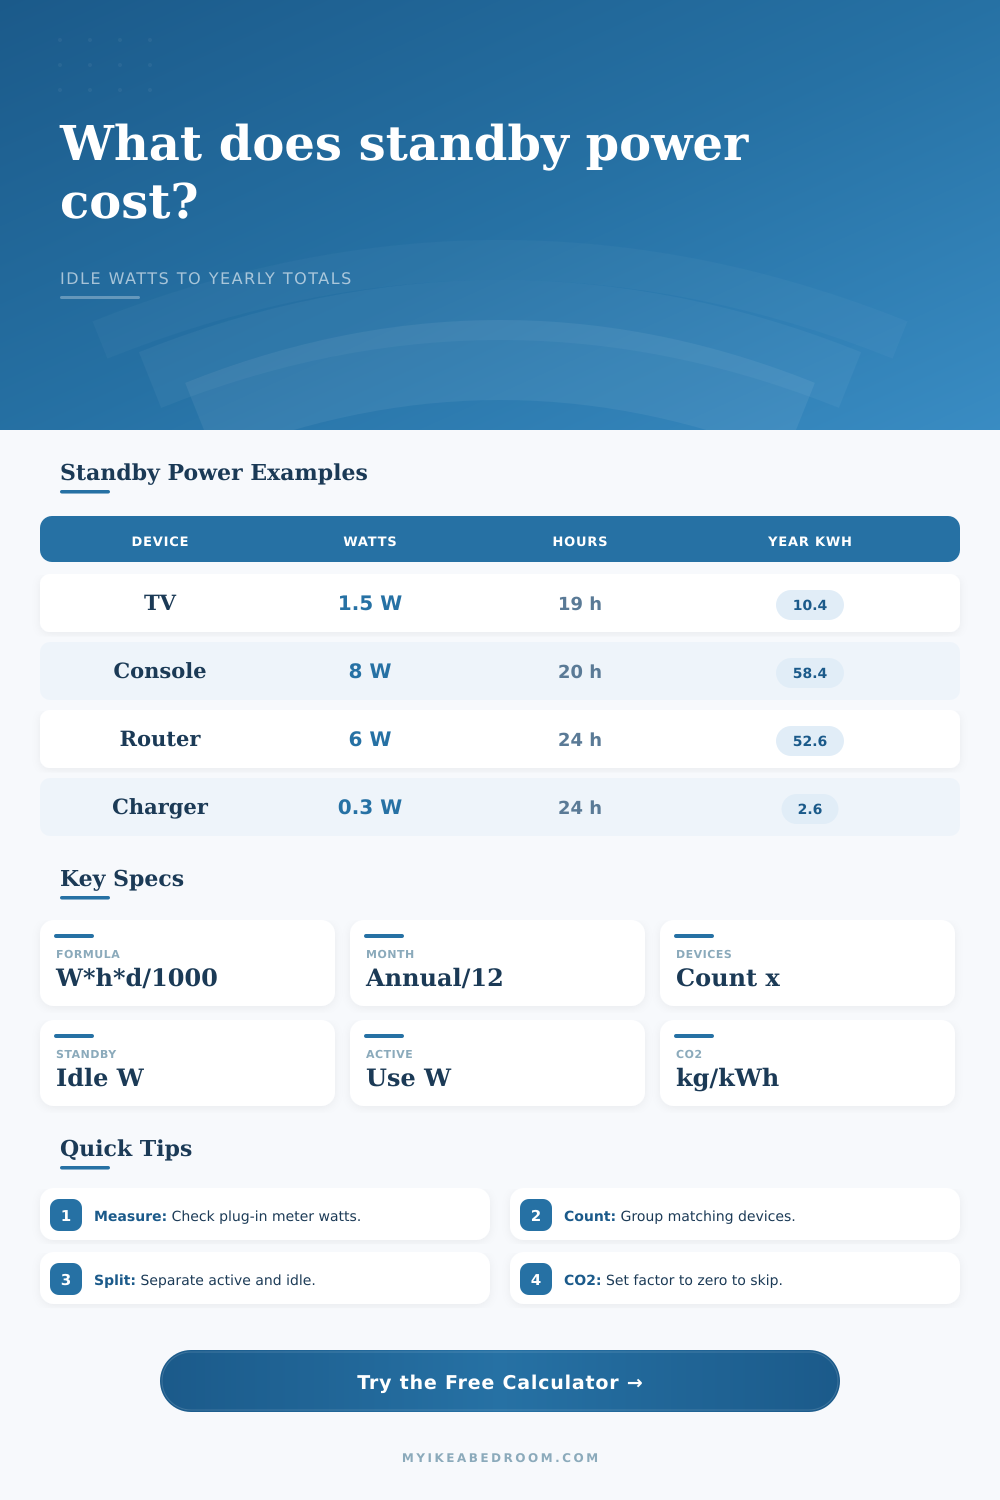
| 8 W | 20 | 58.4 kWh | $10.51 |
| 12 W | 24 | 105.1 kWh | $18.92 |
💡Standby calculation tips
It’s tiny. And it’s easy to ignore. But it costs you money anyway.
Money you can’t even see: standby power. You could think of it as convenience. The power company thinks of it as load. That’s why there’s a little bit of red on your TV. That’s why the clock glows on your microwave. That’s why the router hums along.
Stop Wasting Money on Standby Power
They’re doing nothing. At least they are not doing anything actively. But they’re pulling power. Power that you don’t notice. This power adds up fast.
The big-ticket items get noticed, the electric heater, the air conditioner. They’re important! But there is also an invisible baseline amount of electricity that all your stuff use when it is “sleeping.” This is the baseline power consumption, whether you are home or not.
After entering your usage patterns and the wattage of each device, the calculator do the rest of the math. You won’t have to guess about coefficients and other hidden conversions. It distinguishes between energy you actively desire (active), and the idle energy you merely accept.
Why’s that important? A lot of folks think that when something is turned off, it consumes no energy. Not always. Today’s gadgets are complex; they’re not equipped with simple on/off switches. They go into a lower-power mode instead. Displays maintains time. Microprocessors listen for voice commands. Network interfaces remain powered on.
The calculator asks for standby watts as well as active watts. At a glance, you’ll know how much of your bill pays for performance vs. This is for convenience.
So what about the inputs? What are they? The inputs are a little detective work. Most folks don’t realize what wattage their devices pull. You can’t always rely on the sticker on the back of the box, because it usually lists max draw rather than idle draw. This is because labels most often show max draw instead of idle draw. How much does your router really draw when you aren’t using it?
To find out, use a simple meter plugged into an outlet. You’ll discover that your game consoles only drawing 12 watts in rest mode, but out all day while you work at your job? Sounds like nothing. But think again. Twelve watts over twenty hours a day, every day of the year, is a significant chunk of electricity. See the reference table. If you don’t own a meter, the table below gives you a place to start. Most folks don’t keep track. If you don’t already, the table also shows you just how wide the variance can be based off features and settings.
It’s a simple formula. Watts times hours times days divided by one-thousand equals kilowatt-hours. Then it applies your local electricity rate. But the multiplier effect comes in. Five dollars per year for one device. Fifty dollars for ten devices. That can go up into the hundreds in a smart home, where all those connected cameras, thermostats, speakers and lights is sucking up energy when not in use.
The calculator breaks this out into both an annual total and a monthly figure. And you can turn on a carbon factor to include the environmental impact. This adds another layer of context to the decision.
A lot of folks say they want to unplug their gadgets. But they’re afraid of losing data or hurting their electronics. Unplugging isn’t free (for most moddern stuff), and it’s generally OK to leave them plugged in. Whether or not you should unplug comes down to how much you care about saving vs how much hassle you’ll go through. If you only have one charger, then there isn’t any money to be saved. If you have an entire entertainment center sitting on standby while you sleep, then there is some money to be saved.
The tool gives you a sense of what the idle power costs on its own. Is the money worth flipping a switch?
These little drains don’t appear on your bill as spikes in electricity consumption. They’re part of the baseline. It’s easy to overlook them. But that base line is made up of hundreds of little leaks. If you plug each one individually, you can lower the bottom level of your energy use. You don’t have to go around unplugging everything. Just know what’s costing you money. Awareness.
When you look at the numbers, you can choose which conveniences you think are worth the price. Which ones are simply waste. As long as you don’t notice that small, invisible theft, then it isn’t a problem. You should of checked your meter earlier. All these furnitures adds up. The cost is more higher than you think. It could of been avoided if you knew. Use the calculator to see how much power is wasted.