Kitchen Remodel Budget Breakdown Calculator
Split a user-entered kitchen remodel budget into cabinets, counters, appliances, labor, plumbing, electrical, contingency, and remaining finish allowance.
Presets only fill example percentages and room sizes. Replace every value with your own approved budget before planning.
Detailed Budget Breakdown
| Category | Percent | Base allocation | Low variance | High variance |
|---|
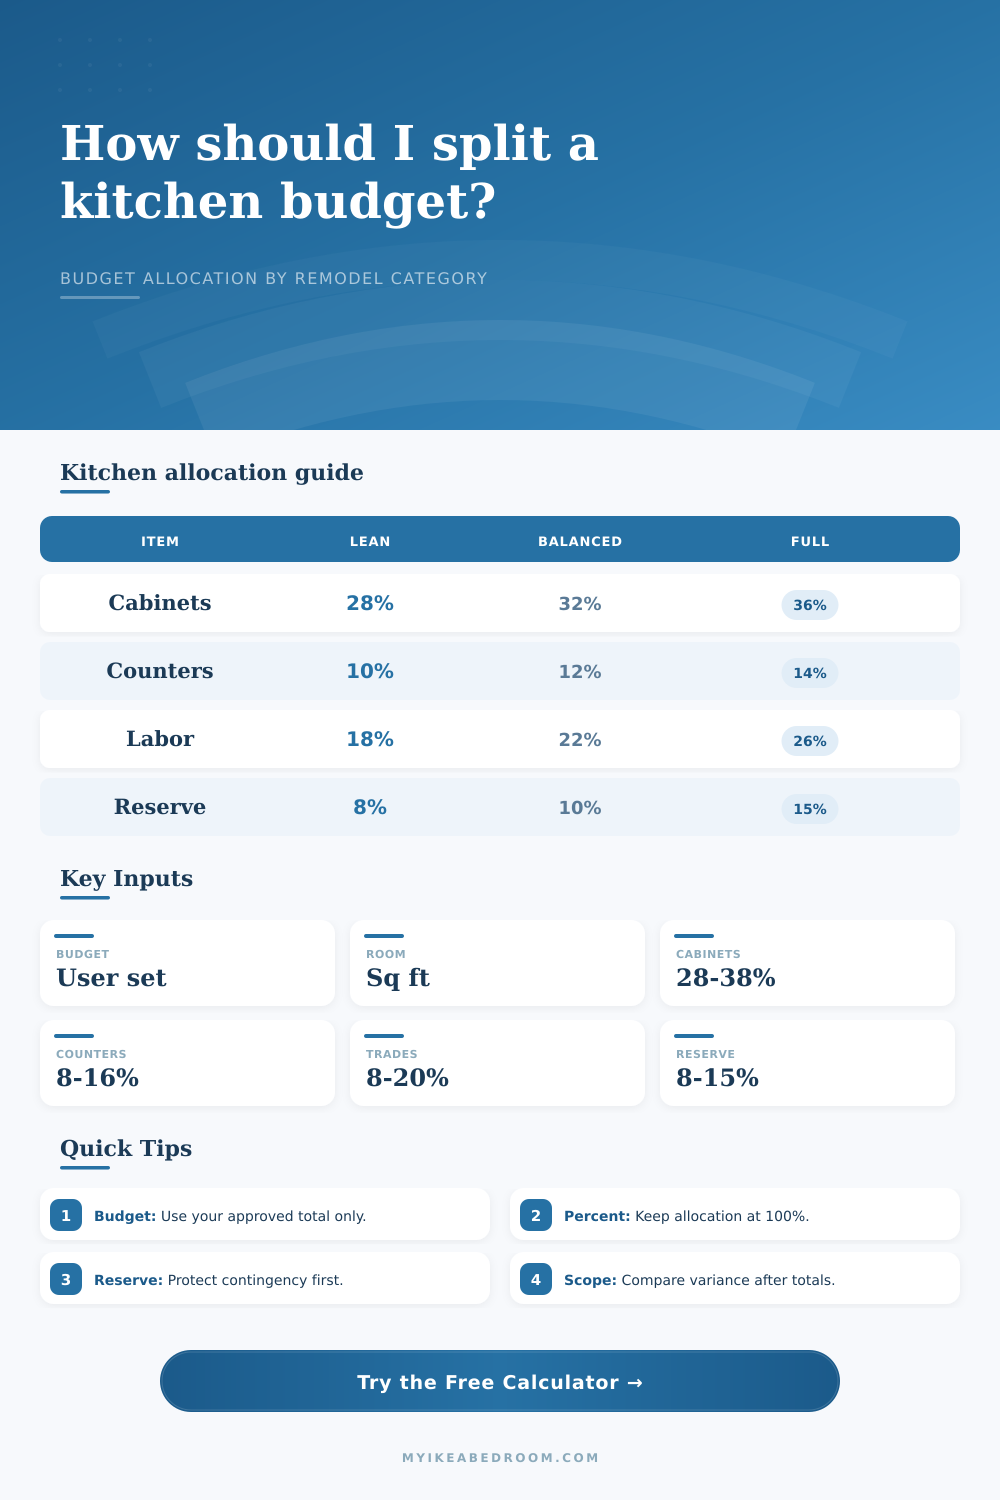
| Budget category | Lean allocation | Balanced allocation | Heavy allocation |
|---|---|---|---|
| Cabinets | 26% to 30% | 31% to 35% | 36% to 40% |
| Counters | 8% to 10% | 11% to 13% | 14% to 16% |
| Appliances | 10% to 12% | 13% to 15% | 16% to 18% |
| Labor | 16% to 20% | 21% to 24% | 25% to 30% |
| Plumbing and electrical | 6% to 9% | 10% to 13% | 14% to 20% |
| Contingency | 8% to 10% | 10% to 12% | 13% to 15% |
| Kitchen preset | Room size | Cabinets | Trades focus |
|---|---|---|---|
| Galley refresh | 90 sq ft | 30% | Lower plumbing and electrical percentage when the existing layout stays intact. |
| Small condo kitchen | 110 sq ft | 32% | Balanced category spread with room for a protected contingency line. |
| Family L-shape kitchen | 180 sq ft | 33% | Labor and counters rise as usable prep and storage zones expand. |
| Island upgrade | 210 sq ft | 31% | Electrical and plumbing percentages increase when services move into the island. |
| Full-scope kitchen plan | 260 sq ft | 35% | Higher contingency protects the plan when layout, trades, and finishes all change. |
| Percentage check | What the calculator does | Result to watch | Planning response |
|---|---|---|---|
| Under 100% | Places the unassigned percentage into the finish allowance row. | Finish allowance card | Name that allowance clearly so it does not become an accidental extra bucket. |
| Exactly 100% | Shows all budget assigned across the entered categories. | Status line | Review contingency before locking the plan so risk is visible from the start. |
| Over 100% | Flags the overage and shows a negative remaining allowance. | Percentage total | Reduce one or more categories until the allocation total returns to 100%. |
| Variance applied | Calculates a low and high scenario around each entered category amount. | Variance table | Use the range to pressure-test allocations without changing the base budget. |
| Room-size input | Formula | Output | How to read it |
|---|---|---|---|
| Room size | Total budget ÷ sq ft | Actual budget per sq ft | Shows how tightly the entered total spreads across the whole kitchen footprint. |
| User benchmark | Sq ft × benchmark | Benchmark total | Compares your own planning benchmark with the total budget you entered. |
| Benchmark gap | Budget minus benchmark | Positive or negative gap | Helps identify whether the entered budget is above or below the planning target. |
| Variance percent | Amount × variance | Low and high range | Displays scenario movement without adding outside category assumptions. |
If you’ve ever attempted to reconcile a fixed kitchen budget with an overall kitchen design, you might have felt a bit swamped. Cabinets sound easy enough, but then you don’t know how much that countertop will cost. And the counter cost doesn’t leave room for sink! Being disciplined about how you assign your money can go a long way, more than just focusing on a specific dollar figure.
When you enter in your desired percentage allocations (and room dimensions) into the calculator above, it do the math for you. No need to fret over if your pie chart sums to a hundred percent, no need to guess the numbers. Instead of running after every line item, you think about entire system.
How to Plan Your Kitchen Budget
These are big ticket items. In a typical kitchen remodel, most homeowners begin here. The cabinets and counters has the biggest visual impact in the room, and they also affect the budget the most. We tell people to reserve about thirty percent for their cabinets and another dozen percent for solid surface/countertops. Why? Because they do take special hardware, custom fabrication, and a lot of install labor. And the counters mean a precise cut, templating, and some amount of material waste.
Overspending (or underspending) on these elements will be felt daily. Overspending on these elements, and not cutting back elsewhere, will leave you broke for what really makes kitchen work. But there are hidden costs that seep into this equation as well.
There is never just one line item for labor. You will get cabinet installers. You will also need plumbers to move sink lines, electricians to move outlets, and people for demo and prep work. This is all general labor. And they don’t typically bill per-square-foot; rather, they bill per job or per hour. Running new services under finished floors (like an open-plan remodel with a new island) will cost thousands more than keeping plumbing static (which is what you might be able to do in a galley kitchen refresh).
The tool’s variance scenario allow you to play out these risks. Add a positive or negative percentage to your totals, and you can see whether or not you’ve got room for cushioning if you find rot behind your walls, say, and need a plumber to fix it.
The contingency is the single most misunderstood item on your remodeling budget. This isn’t your slush fund for upgrades; it’s insurance from reality. Ten to fifteen percent is what most pros suggest for older houses. Plan for eight percent if you’re renovating something newer and getting lucky.
If you eliminate that line item, you think you’ve got the perfect plan. You don’t. Always expect some surprise in drywall. The electrical panel will be out-of-date. Your permit costs will come in higher than expected. By treating that contingency as your first line of protection, you’ll have a buffer when life happens. You won’t have to decide between paying off a credit card or keeping the new faucet.
After paying for the big categories, there’s some amount left over, which I call the finish allowance. This includes paint, lighting fixtures, flooring, and backsplash. Because each item on its own seem small, it’s easy to lowball this number. Sure, a light fixture doesn’t cost much. But you need six of them (and wiring). And yeah, tile on a backsplash looks cheap. But it adds up: twenty square feet. The point of the calculator is that it forces the remainder into a clear label, so you don’t ignore it. If you name the allowance clearly, it becomes harder to treat as a ghost category, with money slipping away without a trace.
I think about things in percentages instead of dollars, which realy helps. I have a 45k budget for my kitchen, but I have a 180 sq ft kitchen. Another person could have a 260 sq ft kitchen with the exact same budget. That’s quite a difference! This makes me realize that we are comparing apples to apples when we talk about a per square foot standard. When you know what you should of expected to pay in comparison to the broader market, then you can see how far above or below the average you actualy spent.
For example, if you’re far above your benchmark, you may have over-scoped your project. Far below? Well, maybe you’ve cut corners that will bite you down the road.
You want something that doesn’t break the bank, works well, and looks nice. The tool provides the structure so that you can make this decision deliberately. It transforms the mess of a wish-list into a feasible plan. Sure, you still get to choose the tile, but now you know whether you can afford it.