WiFi Access Point Coverage Calculator
Estimate home access point count from total area, floor count, wall attenuation, AP coverage, roaming overlap, 2.4 GHz, 5 GHz, 6 GHz range factors, and device density.
▶Home And Network Presets
Choose a common home layout, then fine tune the walls, band priority, overlap, device density, and AP capacity for the real floor plan.
⚙Coverage Inputs
📶Coverage Snapshot
The calculator compares unique coverage per AP against home area, floor count, wall attenuation, overlap, and active device load.
WiFi Access Point Estimate
Coverage And Capacity Breakdown
📊Band Range And Wall Factors
🧮Formula Used
AP count = max(area APs, capacity APs, floor minimum)
📋Reference Tables
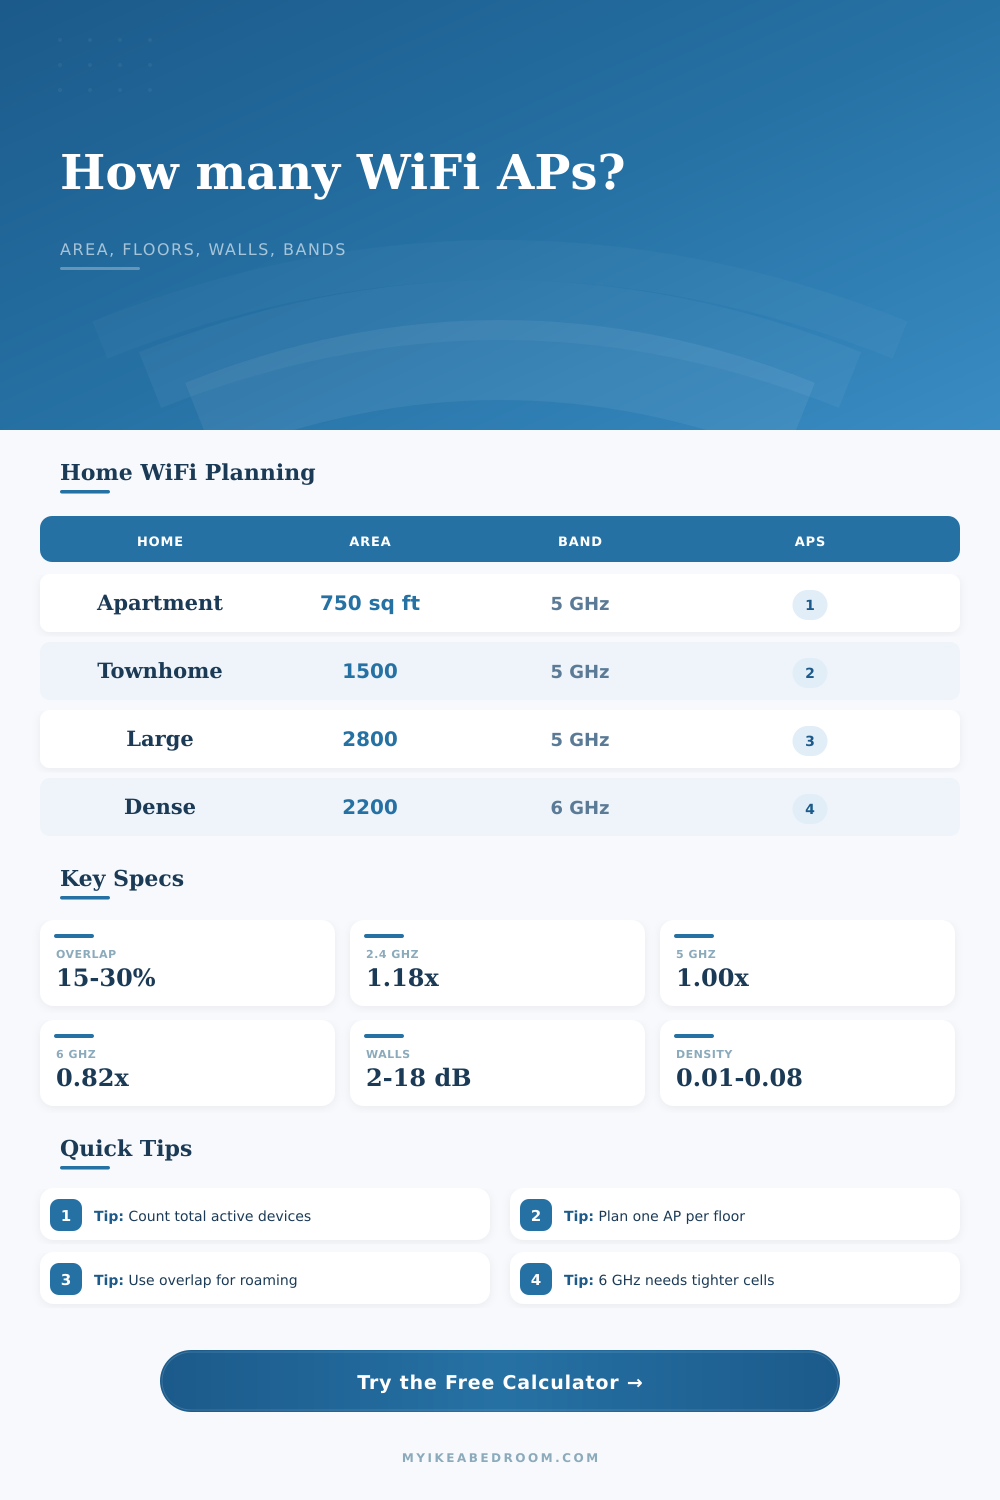
| Planning band | Range factor | Best use | AP impact |
|---|---|---|---|
| 2.4 GHz | 1.18x | IoT, reach, low data rate | Fewer cells, more shared airtime |
| 5 GHz | 1.00x | General phones, TVs, laptops | Balanced home planning baseline |
| 6 GHz | 0.82x | Shorter high-speed rooms | More APs for the same area |
| Balanced mix | 0.96x | Tri-band roaming design | Slightly tighter than 5 GHz |
| Profile | Loss | Coverage factor | Use when |
|---|---|---|---|
| Open plan | 2 dB | 0.91x | Few walls and clear sight lines |
| Typical drywall | 5 dB | 0.78x | Bedrooms, hallways, normal rooms |
| Dense rooms | 8 dB | 0.66x | Many closets, baths, cabinets |
| Plaster or masonry | 12 dB | 0.50x | Older walls, tile, brick sections |
| Concrete or metal | 18 dB | 0.36x | Concrete, foil, metal mesh, brick |
| Home type | Area | Floors | Typical AP count |
|---|---|---|---|
| Open apartment | 500-900 sq ft | 1 | 1 AP |
| Small single-floor home | 900-1,400 sq ft | 1 | 1-2 APs |
| Medium two-story home | 1,600-2,400 sq ft | 2 | 2-3 APs |
| Large or dense home | 2,500-4,000 sq ft | 2-3 | 3-5 APs |
| Density | Devices per sq ft | Example | Capacity note |
|---|---|---|---|
| Light | 0.015-0.025 | Phones, laptops, TVs | Coverage usually drives AP count |
| Moderate | 0.030-0.045 | Streaming plus work calls | Check active client load |
| Dense | 0.050-0.070 | Cameras, speakers, sensors | Capacity can add APs |
| Very dense | 0.080+ | Smart home and guests | Use smaller cells and more APs |
💡Planning Tips
Planning for WiFi is 90 percent human behavior, geometry, and physics, not electronics. Most of us purchase our initial access point as if we were purchasing a lamp. We select one based off how big the room is, find an outlet somewhere near it, and pray that it covers bedroom. In most cases, it doesn’t provide speeds fast enough to support video call.
Enter the calculator above. Plug in your floor plan and device habits. Let it do the math. Skip the guesswork about conversions and coefficients. But know what? Knowing why those numbers exist prevents you from over-buying (or under-performing).
Why WiFi Planning Is Harder Than You Think
The largest pitfall is thinking signal area equals square footage. It doesn’t. Radio waves gets eaten up by walls. While a typical drywall wall might only shave a few decibels off your signal, it is barely noticeable. But concrete, plaster or brick behave like a black-out curtain. If you’re in an older house with heavy masonry walls, you’ll have much less effective coverage. There’s no way for the signal to get through it and your usable distance will be lower than match. In fact, as shown in the table on the page, heavy material can block over half your usable range.
Don’t think of it like a flat map. Think of it as a maze full of things that don’t want you to connect.
What about the frequency bands within your router? There is 2.4 GHz, 5 GHz and now 6 GHz. Here’s a quick refresher on what they mean: The lower the number, the further that frequency can travel. That’s just how radio waves work. 2.4 GHz has long, lazy waves. These travels far and bounce around well. That means it reaches distant corner that higher frequencies don’t hit very well. Great for reach, not so much for speed.
Conversely, 6 GHz has short, fat little waves that are super fast but don’t go very far. If you’re streaming 4K in certain rooms or doing a lot of gaming, then having stronger access points in those areas is important. Add some units and you’ll ensure a strong high-frequency signal. In other words, you’re sacrificing range for speed. That’s something to consider if you’re trying to decide whether to buy one good unit versus three cheap units.
And then there’s roaming. As you move about your home, you’d like your phone to roam easily from one access point to another. But what happens if the signal strength is too low? Then your connection drops. What if two overlapping signals are too strong, but uncoordinated? Now your phone gets confused. It’ll stick with the remote signal instead of jumping to nearby one. To encourage handoffs yet avoid interference, we need just the right amount of overlap: typically somewhere between 15% and 30%. Too much and it becomes noisy; too little and you have dead zones.
And lastly, take into account what’s connecting; and who’s connecting. People often think about WiFi in terms of range, but capacity matter too. One access point can easily blanket your big living room. Try to have 40 phones, laptops and smart device all streaming at once and you’ll be choking. That’s where device density comes into play: How many active clients are there per square foot? If you’re on a light set up (just using a laptop and a phone) then broad coverage should do fine. But if you’ve got a smart home full of speakers, sensors and cameras, you’ll want more tightly packed cells so they can shares the airtime.
The tool above takes this into account. It makes sure you’re giving enough bandwidth to actualy devices that need it, not just blanketing space with signal.
It’s a balancing act when planning out your WiFi network. Two things can’t be infinitely fast and far reaching while using very little hardware. Pick two. If it’s a sprawling home across multiple floors, or thick walls everywhere, or demanding devices… whatever the case may be, you still end up wanting the signal to go where needed, not necessarily where it was pluged in. You should of begun with the layout. Compensate based on what’s in the way. Use the math to guide hardware selection. Better to have a handful that do their part well than one who tries to do it all.