Home Improvement ROI Calculator
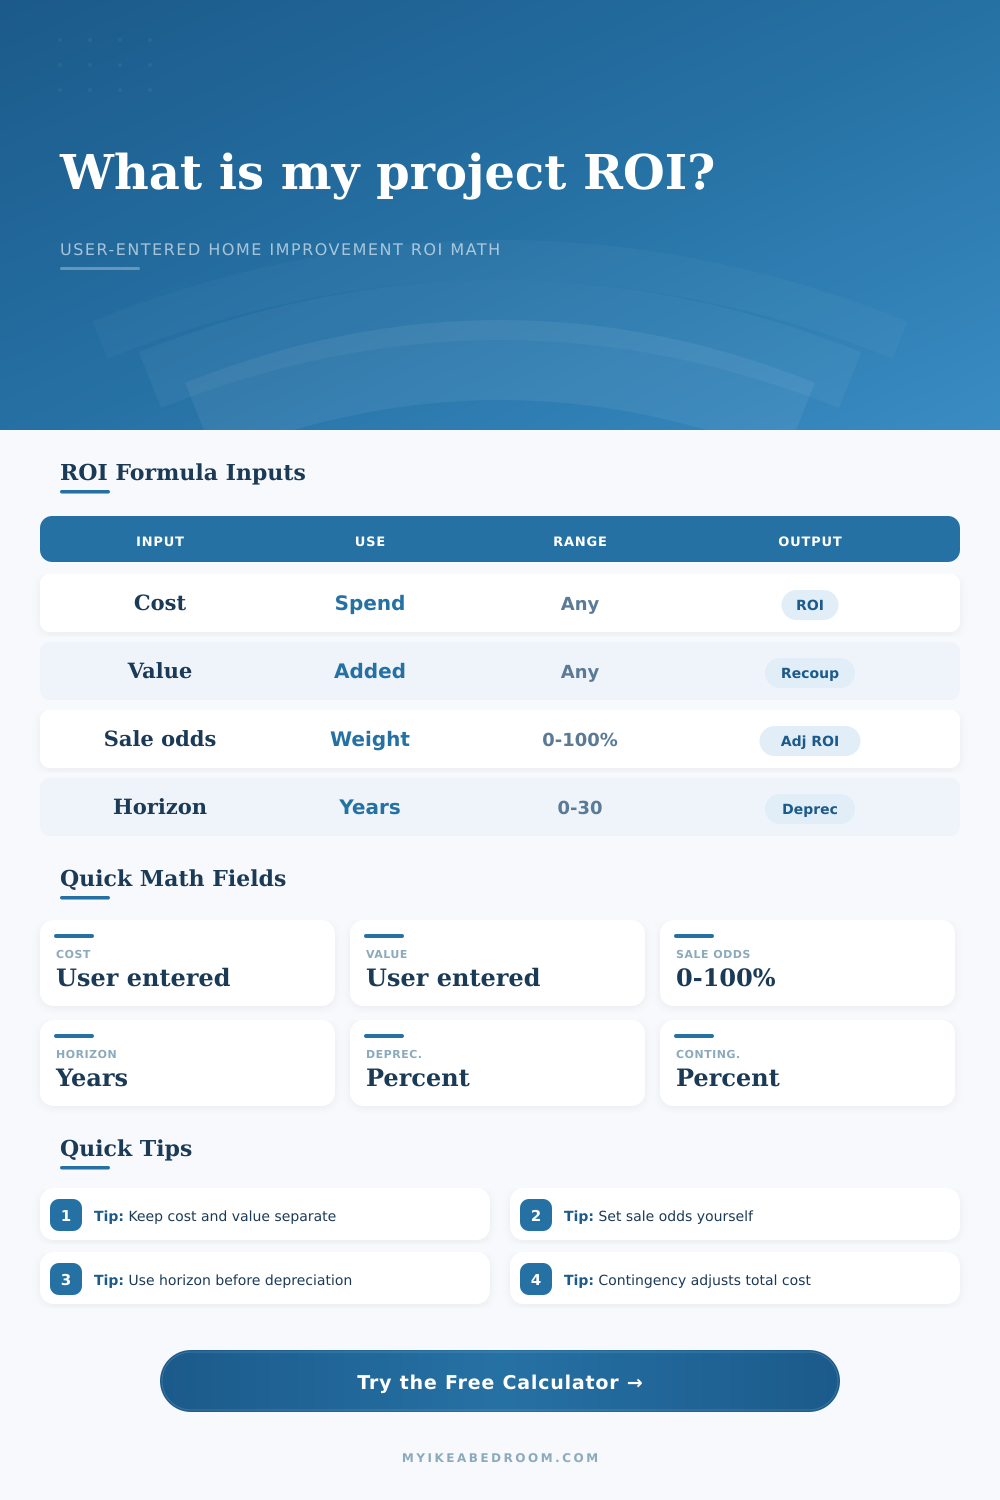
Enter your own project cost, estimated value added, sale probability, time horizon, depreciation, contingency, and transaction share to calculate ROI and recoup values.
Presets only populate editable fields with sample numbers; the calculator uses the values currently entered in the form.
Calculated ROI Results
| Metric | Formula Used | Uses | Result Meaning |
|---|---|---|---|
| Base ROI | (net value - adjusted cost) / adjusted cost | Cost, value, contingency, depreciation, selling cost | Percent gain or loss from entered cost |
| Recoup percent | net value / adjusted cost | Depreciated net value and adjusted cost | Share of cost returned as value |
| Depreciated value | value added x (1 - annual depreciation) ^ years | Estimated value added, depreciation, horizon | Modeled value at the end of the horizon |
| Weighted ROI | (probability-weighted value - adjusted cost) / adjusted cost | Sale probability and depreciated net value | ROI after applying entered sale probability |
| Preset | Project Cost | Value Added | Sale Probability | Horizon | Depreciation | Contingency |
|---|---|---|---|---|---|---|
| Kitchen refresh | 12000 | 9000 | 70% | 3 years | 3% | 10% |
| Bathroom update | 8500 | 6400 | 65% | 4 years | 3.5% | 12% |
| Window replacement | 18000 | 12500 | 60% | 8 years | 2.2% | 8% |
| Attic insulation | 3200 | 2600 | 45% | 6 years | 1.8% | 10% |
| Hardwood refinish | 5600 | 4800 | 55% | 5 years | 4% | 9% |
| Deck repair | 14000 | 9300 | 50% | 7 years | 5% | 15% |
| Garage door | 4300 | 3900 | 75% | 3 years | 2.5% | 7% |
| Entry door | 2900 | 2400 | 72% | 4 years | 3% | 7% |
| Basement finish | 42000 | 26000 | 42% | 10 years | 4.5% | 15% |
| Paint refresh | 2200 | 1800 | 80% | 2 years | 6% | 10% |
| Line Item | What It Changes | Before ROI | In Base ROI | In Weighted ROI |
|---|---|---|---|---|
| Project cost | Starting cost side of the equation | Entered directly | Yes | Yes |
| Contingency | Raises the cost side by the entered percent | Added to project cost | Yes | Yes |
| Estimated value added | Starting value side of the equation | Entered directly | Yes | Yes |
| Depreciation | Reduces value added across the time horizon | Compounded yearly | Yes | Yes |
| Selling cost | Deducts an entered share from the depreciated value | Subtracted from value | Yes | Yes |
| Sale probability | Weights value by the chance of sale inside the horizon | Applied after net value | No | Yes |
Input tip: Keep project cost and estimated value added as separate entries. The ROI formula uses adjusted cost after contingency and net value after depreciation.
Scenario tip: Change one field at a time when comparing scenarios, then use the breakdown rows to see which input moved the ROI or recoup percentage.
This calculator performs arithmetic from user-entered values only. It does not rank projects, predict market behavior, or decide whether to complete an improvement.
Imagine yourself in an outdated kitchen with decades-old cabinets, stains everywhere, and chipped countertops. You’d like to update it, but you want your investment to pencil out financialy as well.
A common misconception among homeowners is that beauty cannot coexist with logic. That’s usually not true. Certain renovation will increase the value of your home; other remodels will detract from its worth. By concentrating less on looks and more on the math, you’ll be able to separate the two.
How to Get the Best Value from Home Renovations
While the calculator do the math, it’s good to know what those inputs represent. One important variable that many folks overlook is time. Not only will you spend money today; you’re placing a bet on what that money is worth in three or five or 10 years down the road. That’s why the tool prompts you for your time horizon; how far into the future do you intend to hold this property? Do you expect to sell within the next couple of year or will it be more like a decade? Depending on your answer, your strategy shift.
New stuff isn’t forever. That shiny, new surface will eventualy lose value. What appears to be a winning deal during Year 1 might turn sour by Year 7. This can happen because materials wears down or market conditions change.
Another number that distinguishes hope from plan is contingency. Builders recommends having at least a 10-15% contingency. That’s money set aside for things you don’t expect. The calculator has that contingency baked into total cost. Leave out the contingency, and your ROI appears more favorable then it is. Include it, and while not quite as flattering, the picture becomes clear. It is far better to realize the real cost upfront rather than find out about a drywall issue during demo day.
The table of references illustrates how different presets shifts the balance. You might think a new garage door installation is inexpensive, yet the increase in value compared to cost can be significant. Finishing a basement is an expensive project, and in many cases, you won’t get as much back because not all markets place equal value on finished space based off other parts of a home. Other parts of a home.
Intuition and data determine sale probability. Not all homeowners will sell their home. Do you want to remain? Then the daily use of your upgrade is more valuable than the eventual resale value. The tool lets you adjust the probability you’ll sell and weighs it into the ROI. If there’s a 50-50 chance you’ll sell within five years, then the weighted return on investment change. You will no longer make decisions based off a hypothetical exit strategy that might not occur. Instead, force yourself to appreciate the improvement for what it is today and how it serves you now. Value it just as much as how it serves you when you sell.
One mistake that many homeowners make is over-estimating what renovations adds to their home. They believe that the market will love whatever they love about house. That’s typically false. A lot of very specific upgrades (e.g., custom hobby rooms, home theaters) cater only to a small niche of buyers, and, in most cases, won’t give you back your money. General upgrades (i.e., new windows, a fresh coat of paint) will generally get more back, and are also viewed favorably by prospective buyer. They’ll increase value and meet the basic expectations of buyers.
To see the dynamic at work, I’ve included some of the reference tables below. You’ll notice that for percentages alone, small projects can outpace larger project. For example, a deck repair might not change the look of the house, but if it boosts curb appeal and avoids a safety issue for little money, the numbers aligns on your side. On the other hand, a huge kitchen overhaul could make your life much better, but if you spend more than the neighborhood values, the math might tell you “no.
It’s about making a smart decision, not about getting rich. You could be renovating to stay or selling; in either case, you know the numbers, which grounds you. The calculator spits out a clear bottom line that includes all those complex curves of depreciation and probabilities and weights. And now you get to weigh whether it’s worth having a beautiful new kitchen even though it will cost a bit more than its fair share of cash. Sometimes the answer is “yes.” You’re making an informed choice, comparing your desires with your financial realities. That tradeoff makes a high-priced mistake into a smart investment.